STATS ON BOWEN - December 2019
Posted on Feb 02, 2020
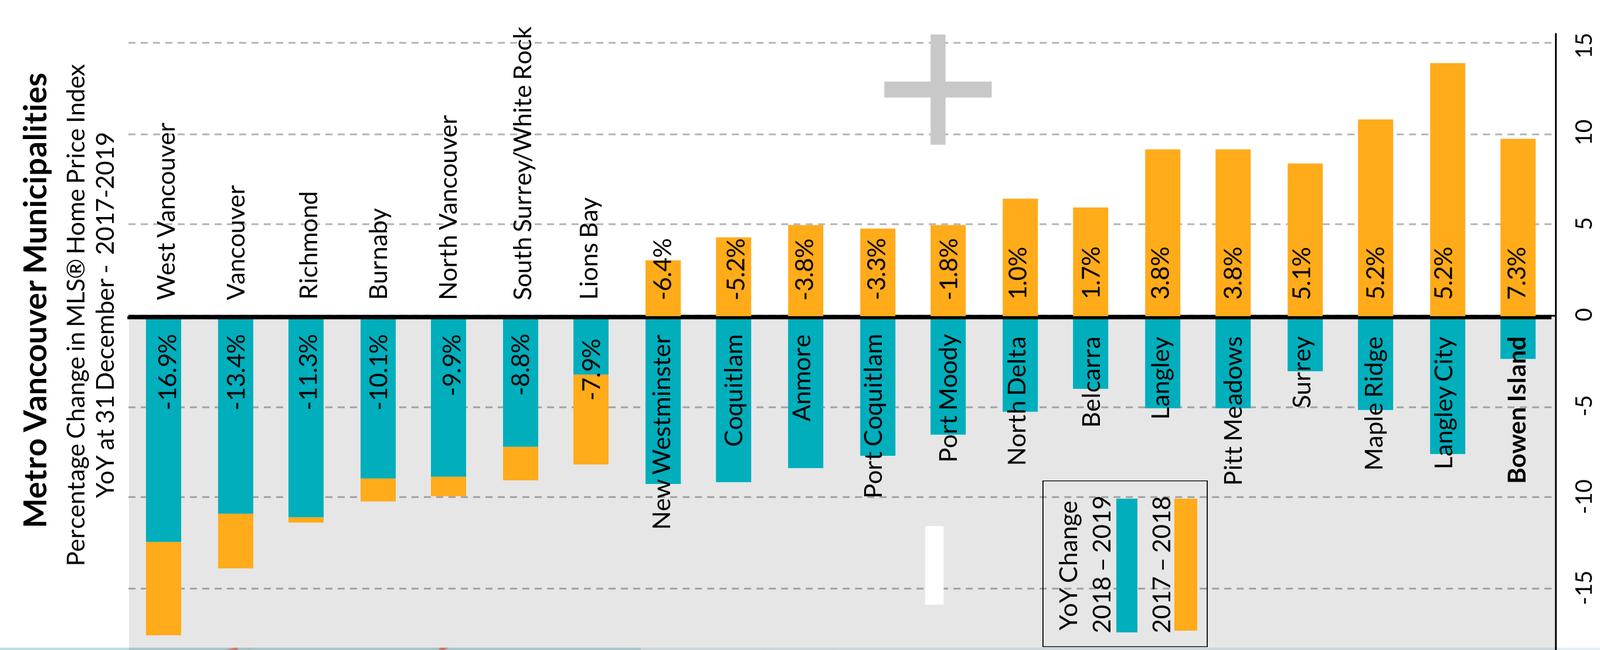
The 2019 YoY MLS® HPI ($969,150) was down a modest -2.3 per cent from the record high in 2018, performing better for this metric than all other Metro municipalities.
There were 88 new listings in 2019 and 45 sales. As of 7 January 2020, there are 15 listings for detached homes on...
Estimated Range of Percentage Changes to 2020 Assessment Values
Posted on Jan 04, 2020
Bowen Island property owners can anticipate a -4 percent change in their BC Assessment; however, actual assessments have been reported from +20 per cent to -10%. You can check your assessment here by entering your property's address.
STATS ON BOWEN is a detailed analysis of activity on Bowen Island published monthly,
usually within seven days from th...
STATS ON BOWEN - November 2019
Posted on Dec 27, 2019
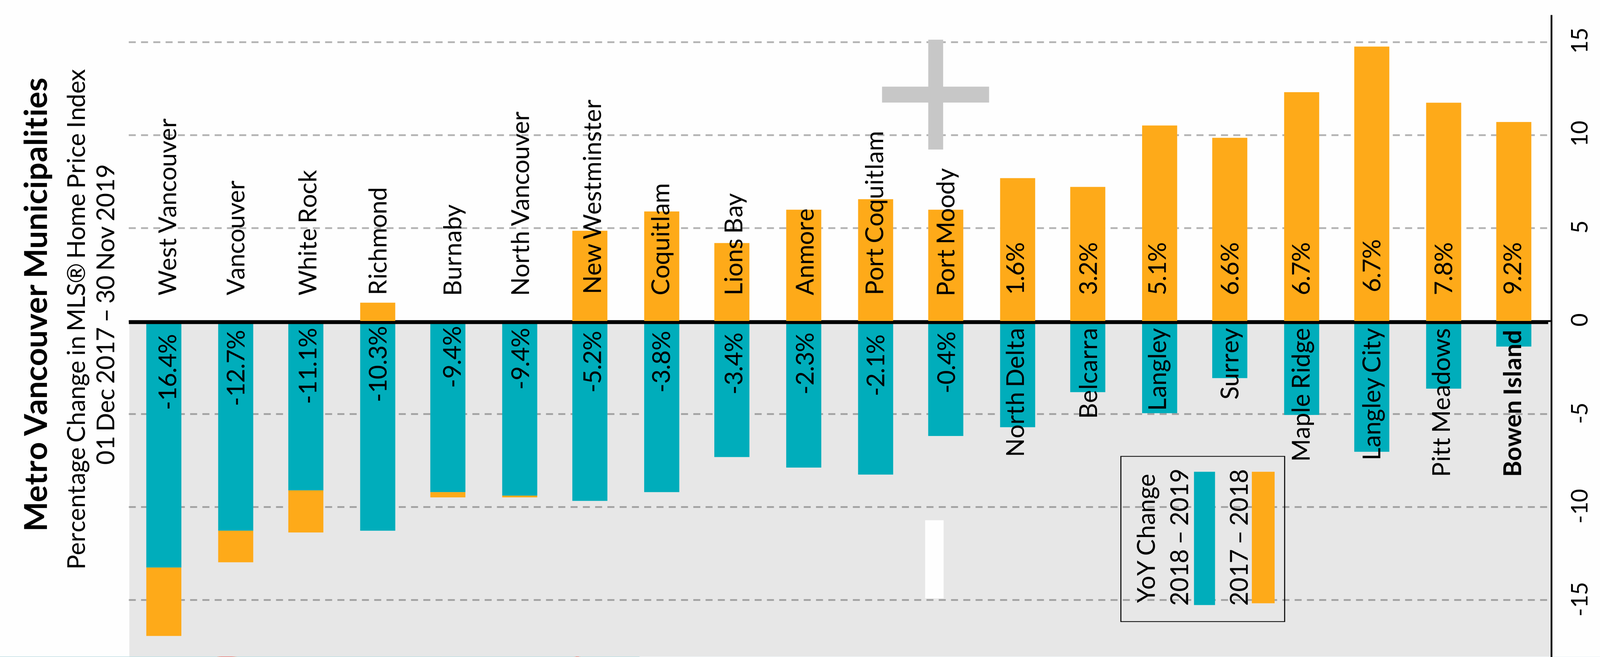
All indicators in November, year-over-year and year-to-date, continue to track well below the same period for 2018.
The MLS® Home Price Index is the most reliable way to compare real estate values across diverse markets like those in Metro Vancouver. Using this index Bowen Island properties performed better year-over-year than all other Metro market...
Cloudy with silver linings
Posted on Dec 14, 2019
As published in Bowen Island Undercurrent, 12 December 2019
STATS ON BOWEN - October 2019
Posted on Dec 07, 2019
STATS ON BOWEN - September 2019
Posted on Nov 07, 2019
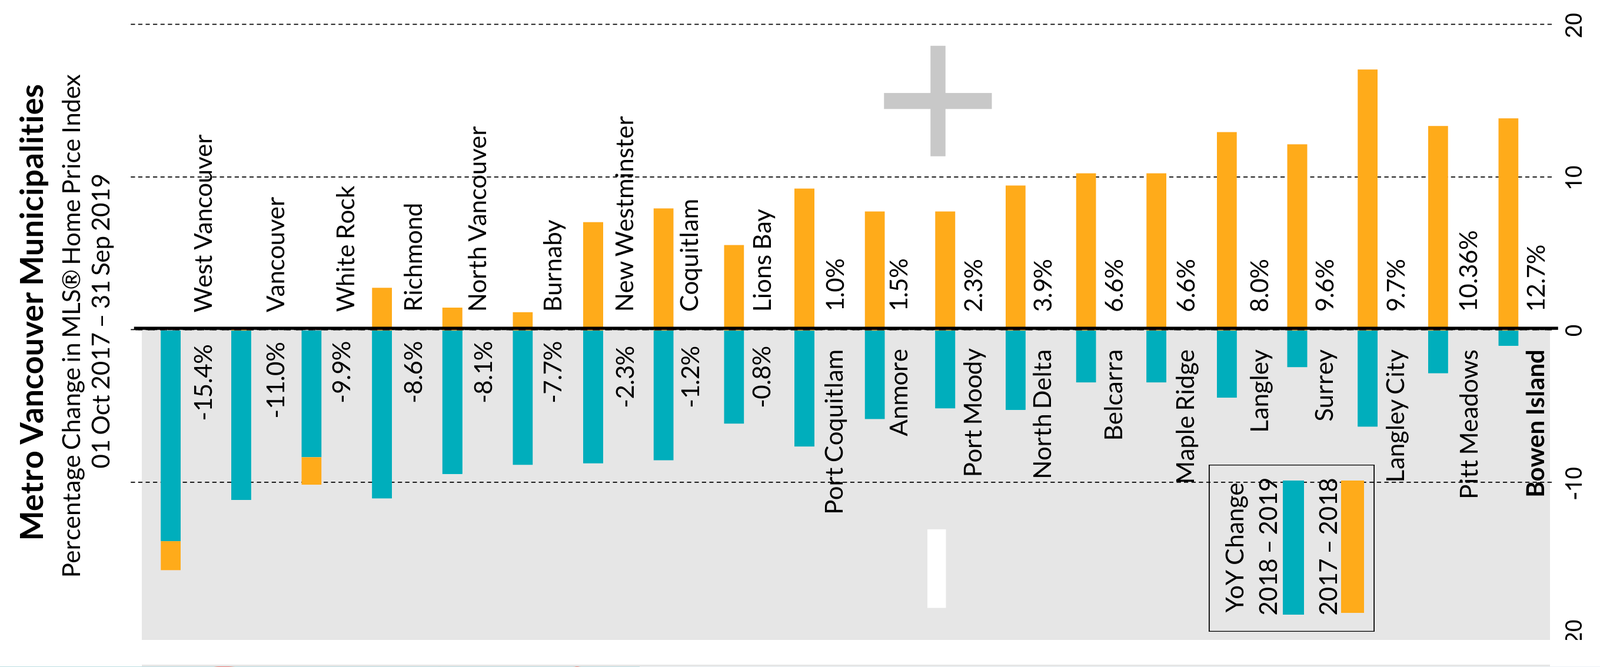
Although still well below the 3-year highs and down year-over-year,September price indicators continued to show signs of stability when compared with August and July of this year. The YoY Average Sales price was up +2.9 per cent from July 2019 and up +0.3 per cent from August 2019. If this trend continues, YoY price indicators could be close to or...