Over three quarters of sales were under $1.2 million year-over-year, a trend which can be attributed to not only the inventory of detached properties in this range, many of which provided more value than equivalently priced properties on the mainland, but also to the mortgage stress test which reduced buying power for many.
Year-over-year the average sale price per square foot, dollar volume of closed sales, and number of sales did not change appreciably from September to October; however, the sale price as a per cent of the list price (the spread between list price and selling price moved from just over 6 per cent to just over 7 per cent, indicating that buyers continue to look for advantage in a slow market.
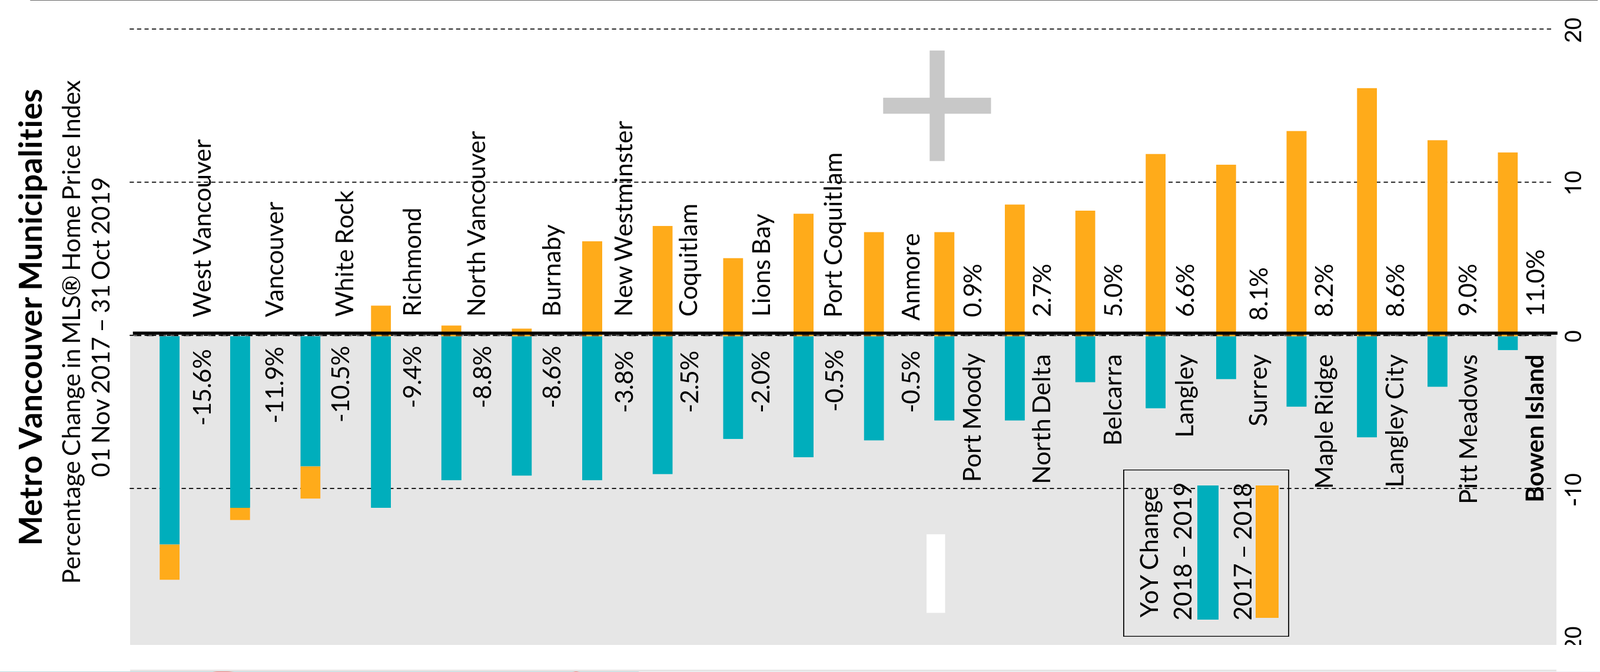
Comparing the MLS® HPI year-over-year for October 2017 to October 2019, Bowen Island real estate continues to lead Metro municipalities. In 2019 Bowen Island was up 11.0 per cent from 2017 followed by Pitt Meadows at 9.0 per cent, while Richmond, North Vancouver, Richmond, White Rock, Vancouver, and West Vancouver MLS® HPI values fell from -8.8 per cent to -15.4 per cent over the same period.
There were no sales of vacant land in October.
There were no sales of vacant land in October.
BOWEN ISLAND YOY STATS
@31 October 2019
MLS®HPI: $985,800
Median Price: $950,000
Average Price: $1,010,522
@30 September 2019
MLS®HPI: $976,192
Median Price: $950,000
Average Price: $1,040,722
MLS®HPI: $985,800
Median Price: $950,000
Average Price: $1,010,522
@30 September 2019
MLS®HPI: $976,192
Median Price: $950,000
Average Price: $1,040,722
STATS ON BOWEN is a detailed analysis of activity on Bowen Island published monthly,
usually within seven days from the end of the month.
If you would like notice of the most recent STATS ON BOWEN sent to your inbox
you can SUBSCRIBE HERE free of charge.
you can SUBSCRIBE HERE free of charge.
WE DO NOT SPAM.
You will only receive email related to the STATS ON BOWEN monthly reports.