February 2025 gains over 2024 but pressure on pricing continues
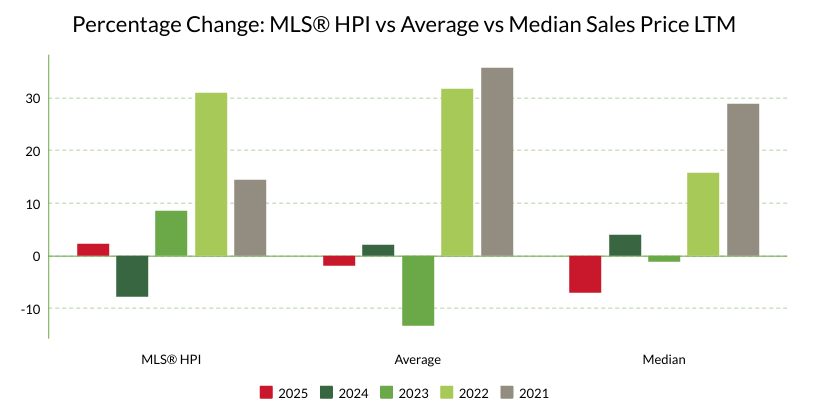
The 2025 Bowen Island MLS® HPI1 was up 0.67 per cent LTM2 from January to February 2025 and represented the largest change across Metro Vancouver municipalities. This represented a 2.4 per cent increase from February 2024. The average MLS® HPI increase January to February 2025 across Metro municipalities was 2.9 per cent, with the largest gain in Burnaby at 6.3 per cent while White Rock registered a loss of -0.2 per cent.
The Average Sale Price (LTM) was $1,562,396, down -1.8 per cent from February 2024 reflecting moderate price corrections as Buyers put pressure of Sellers’ asking price.
Of the 8 properties shown as Closed or Pending Sales from January 1st through February 28th, two properties sold at list and 6 sold below list. Properties were price-reduced by Sellers an average of -8.3% while on the market and by another -3.4% to reach an acceptable offer – a total of -11.7% from the original list price.
The 2 properties valued greater than $2 million were reduced by Sellers an average of -12.4% while on the market and another -8.9% during negotiations, for a total of -20.2% below the original listed price, indicating a softer market for higher value properties.
The length of time from listing to sale for the 8 properties was 215 days – the shortest MLS® CDOM (Cumulative Days on Market) shortest was 2 days and the longest was 565 days.
The MLS® reported four sales in February, up one from 2024. LTM Sales were up 38.5 per cent from 2024, New Listings up 17.0 per cent, and Days on Market down -22.7 per cent and Inventory up +54.5 per cent. Compared to February 2024, the MLS® HPI was up 2.4 per cent, the Average Sale Price was down -1.8 per cent, and the Median Sale Price was down -7.0 per cent.
There were 39 Active Residential Detached Listings at this writing and 18 Active Vacant Land Listings. The Dollar Volume of Sales for February was $11.5 million, almost twice the amount for the month in 2024 and the total volume LTM was $84.4 million, up 36.0 per cent from 2024. There were no vacant land sales in February.
The Bank of Canada reduced its rate by -0.25 per cent to 2.75 per cent on March 12 and will review the rate again on April 16. The erratic actions of the Trump administration have created uncertainty in every sector of the economy and is likely to adversely affect inflation. “Looking ahead, it is unclear where home prices may go in 2025, given the uncertainty surrounding both the possibility of a trade war with the U.S. and the length of the Bank of Canada’s current monetary policy easing cycle.”3
Sellers will need very sharp pencils when pricing their property and can expect continued downward pressure from Buyers.
1 MLS® HPI (Home Price Index) – HPI measures the change in the price of housing features, the typical, pure price change (inflation or deflation).
2 LTM - Last Twelve Months of activity. Represents 12 months of activity
3 https://www.biv.com/biv-rss-newsletter/no-more-boom-and-bust-bc-real-estate-sees-balance-heading-into-2025-10264275
2 LTM - Last Twelve Months of activity. Represents 12 months of activity
3 https://www.biv.com/biv-rss-newsletter/no-more-boom-and-bust-bc-real-estate-sees-balance-heading-into-2025-10264275
FEBRUARY 2025DETACHED HOMES
SALE PRICE vs LIST PRICE
Low $995,000 $995,000
High $2,000,000 $2,250,000
Average Sale in January $1,538,750
Median Sale in January $1,600,000
STATS ON BOWEN
is published monthly once all data for the previous month has been received.
WE DO NOT SPAM.
You will only receive email related to the STATS ON BOWEN monthly reports and the occasional update.