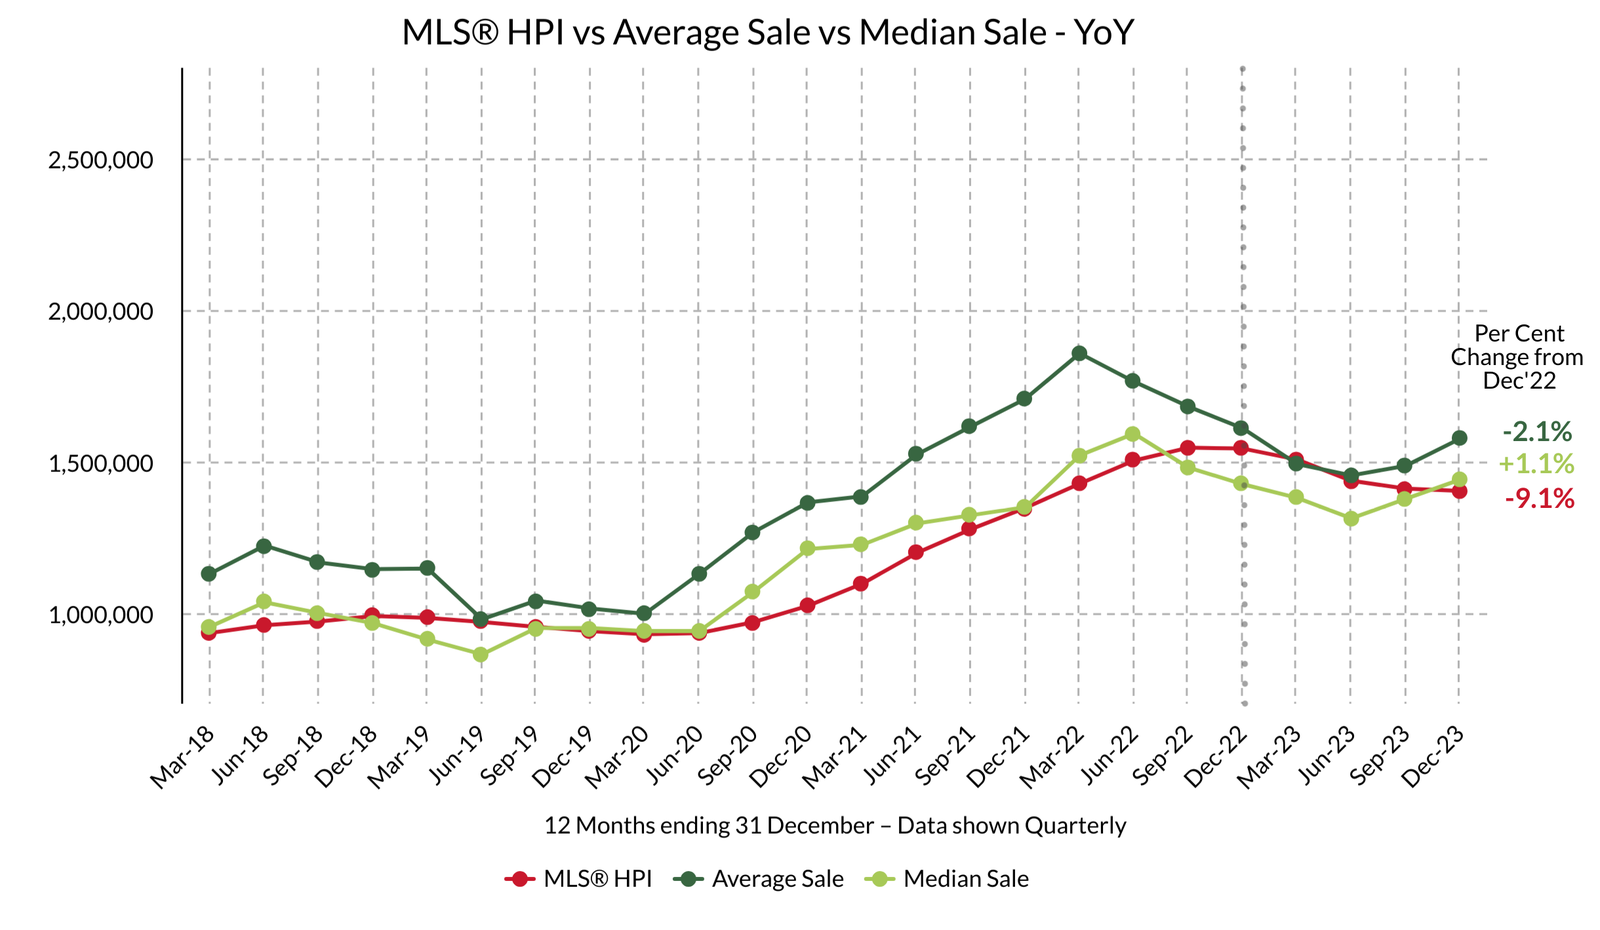
Benchmark price down 9.1 per cent from 2022

The Average Sold Price YoY at the end of 2022 was down 5.7 per cent from 2021 and by the end of June 2023 was down a further 9.7 per cent to -14.7 per cent; however, the Average Sold Price YoY rallied during the last six months of 2023, gaining 8.3 per cent to end the year down 2.1 per cent compared to 2022.
The statistics underscore the lacklustre market with the Number of Sales in 2023 (37) down 41.3 per cent from 2022, while the Average Listing to Contract Days on Market YoY was up 93.5 per cent from 2022. The total Dollar Volume of Closed Sales for 2023 ($58,282,000) was down 74.0 per cent from 2022. Market correction from the COVID era influence (approximately June 2020 to April 2022) began mid-2022 and continued through 2023.
The good news from the last year is that even after market corrections to date, the value of detached homes is significantly higher than YoY pre-COVID values recorded at the end of May 2010. The MLS® HPI or Benchmark Price is up 51.5 per cent and the Average Sold Price is up 61.0 per cent.
Moving into 2024, buyers continue to wait of deals (anticipating further downward pressure on prices or distress sales) or for the anticipated easing of interest rates, and sellers remain reluctant to let go of the idea of 2021 pricing. Activity may pick up if interest rates continue to hold as they did in January and if predictions of lower rates in Q2 and beyond materialize. There has likely been some build-up in demand in the sellers’ market as owners interested in selling have been holding back to see where prices settle, and buyers come back to the market.
Pundits are predicting renewed activity in the Spring with growth in new listings, sales, and sale prices through 2024, and forecasting 2-3 per cent growth in prices and 4-8 per cent growth in sales.
* YoY - Year-over-year or 12 months of activity
2023 Detached Homes
SALE PRICE VS LIST PRICE
Low $795,000 $895,000
High $3625,000 $3,890,000
Average Sale: $1,575,195
Median Sale: $1,440,000
MLS®HPI: $1,402,042
STATS ON BOWEN is published monthly once all data for the previous month has been reported.
WE DO NOT SPAM.
You will only receive email related to the STATS ON BOWEN monthly reports and the occasional update.