The next quarter
Use this link for the interactive report

Number of sales and dollar volume of sales down in August
Coming out of the slowest July and August since 2012, the third quarter of 2021 is shaping up to be the slowest in 9 years, and without new inventory, the 4th quarter will follow this trend.
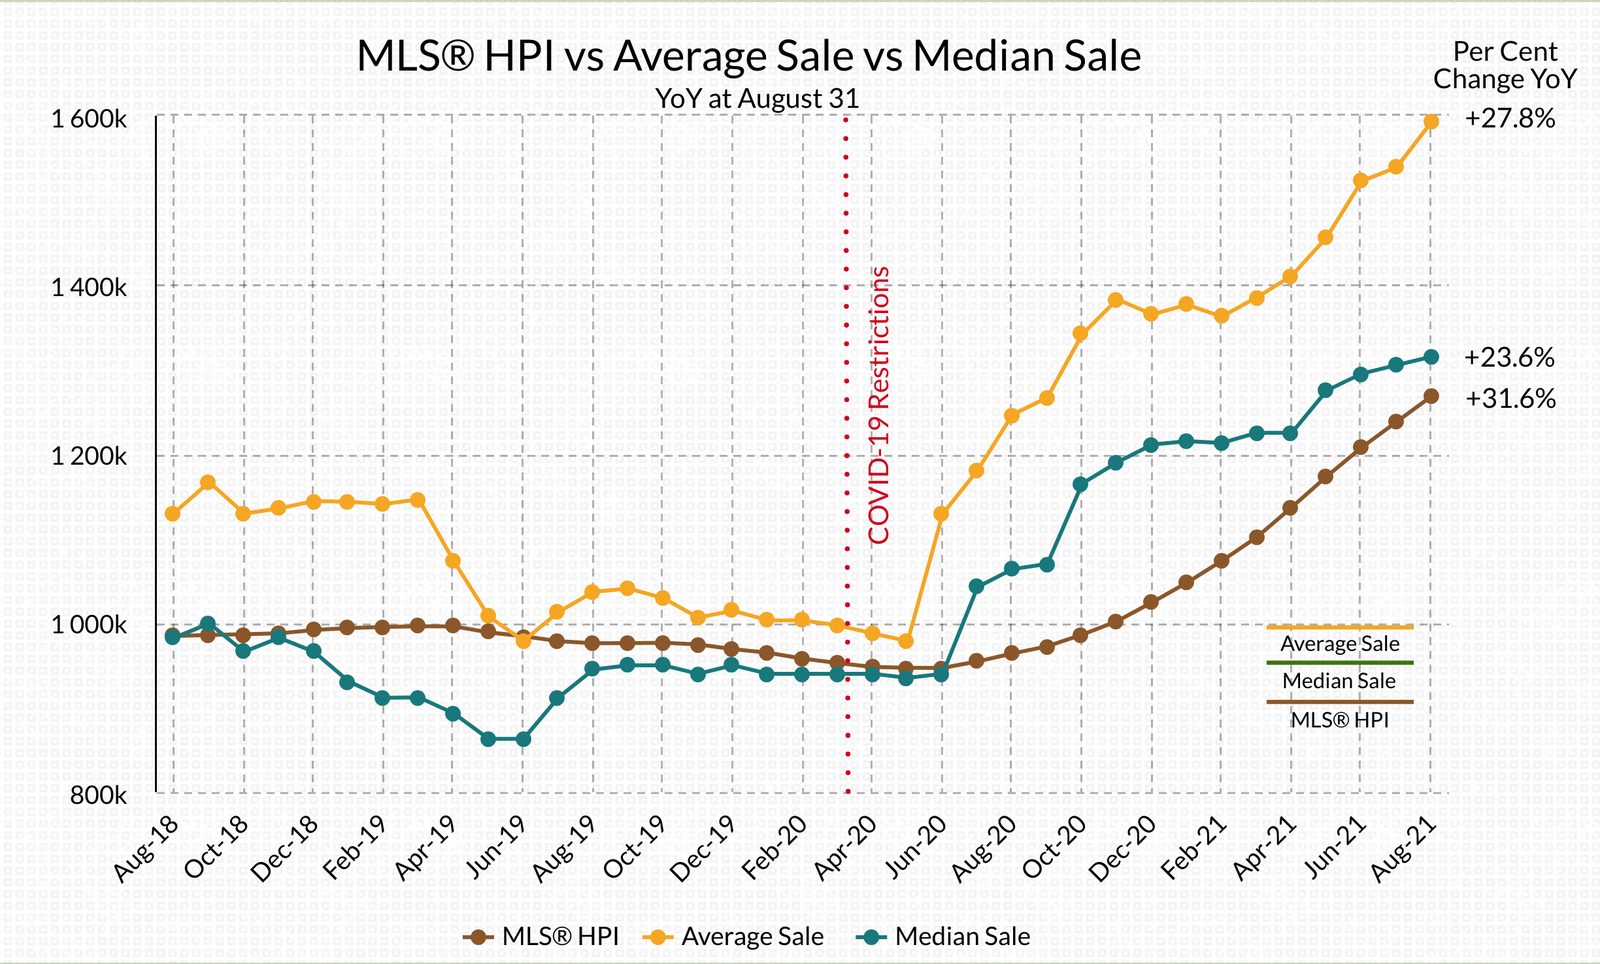
Property sales were slow on Bowen with just 2 sales for the month, an 8-year low; however, the year-over-year (YoY) MLS® Home Price Index, Average Sale Price, and Median Sale Price increased by 31.6, 27.8, and 23.6 per cent respectively. Total inventory was down from the 5-year average for August and YoY inventory numbers were down -44 per cent.
Properties under $1.0 million accounted for 60 per cent of sales YoY ending August 2019, 40 per cent in 2020, and 21 per cent in 2021. At the time of this writing, the least expensive residential detached listing is $1,329,000. It is one of only four properties under $1.5 million.
Lower price properties are increasingly rare. At the time of this writing, the least expensive residential detached listing on Bowen is $1,329,000 (one of four properties under $1.5 million), there are ten properties listed between $1.5 and $3.0 million, and four properties listed over $3.0 million.
YoY Bowen Island’s MLS® Home Price Index or benchmark price was $1,268,242, similar to the median for Metro Vancouver, 25% greater than Maple Ridge (most affordable),, and -57% lower than West Vancouver.
Over the last 10 years, 60% of sales on Bowen Island occurred in the 2nd and 3rd quarters of the year while the 4th quarter has averaged 22% of sales and 15% of new listings. Half of current inventory would have to be sold in September to achieve the average for the quarter.
YoY market indicators for Q4 will remain relatively stable with slight increases likely, except for Number of Sales and the Dollar Volume of Sales which showed decreases YoY for July and August.
Can politicians solve the housing crisis?
The BC Government efforts underwhelmed
All bets are off depending on the actions of the government we elect on the September 20th.
Three of the four national party platforms mention taxing foreign buyers as one of their solutions for housing. The BC Liberals and NDP have already travelled down this road.
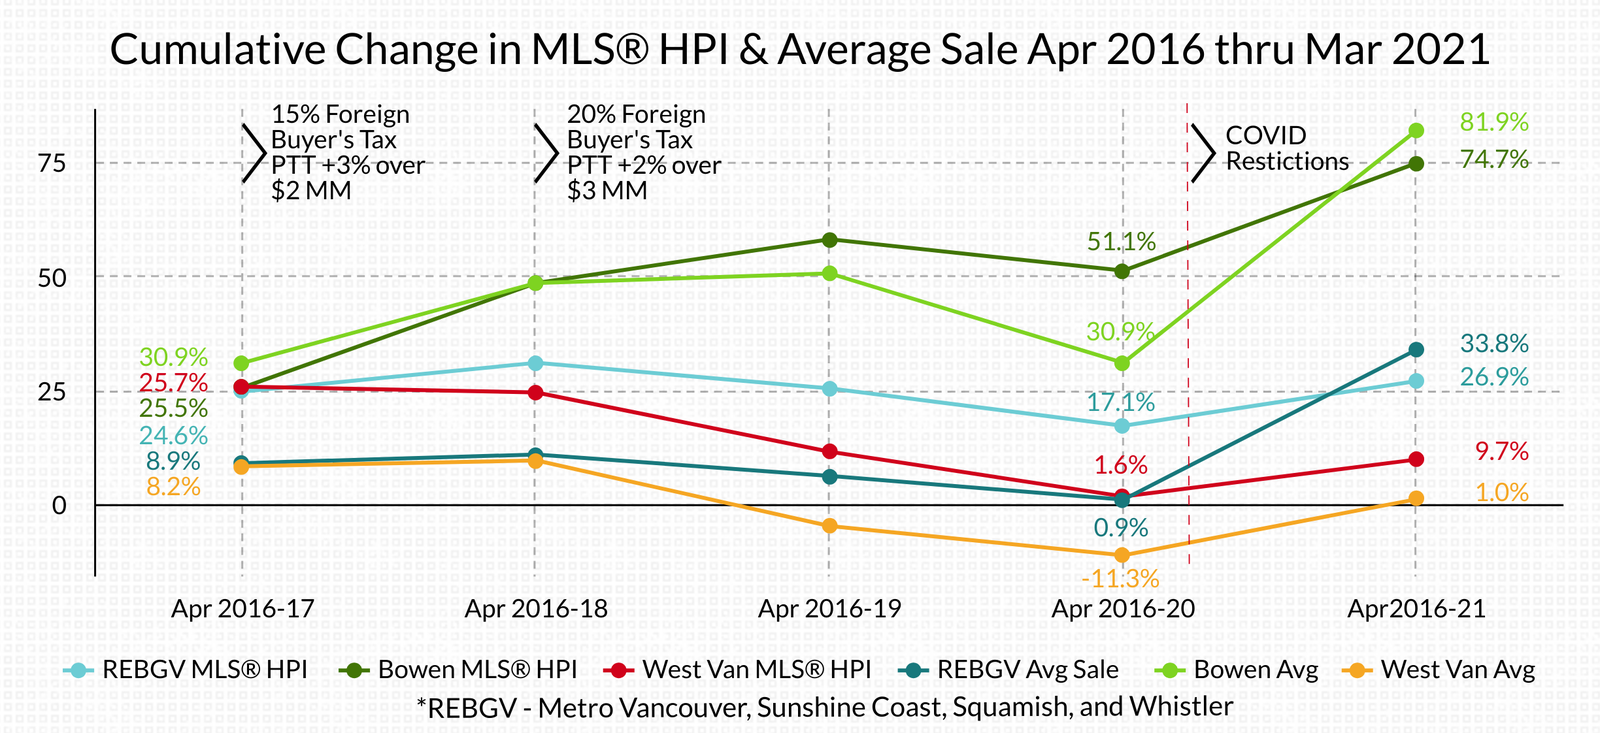
In 2016, the BC Liberals introduced a 15% foreign buyers' tax and increased the Property Transfer Tax (PTT) to 3% on amounts over $2.0 million, and in 2018, the BC NDP increased the foreign ownership tax to 20%, introduced a speculation tax in some jurisdictions, and increased the PTT to 2% on any amount over $3.0 million.
The results for the detached home resale market have been underwhelming except in the high-end luxury markets, which saw dramatic decreases April 2018 through March 2020.
The results for the detached home resale market have been underwhelming except in the high-end luxury markets, which saw dramatic decreases April 2018 through March 2020.
YoY preCOVID
April 2016 through March 2020
- The MLS® HPI prices continued to rise Apr. 2016 through Mar. 2018, some by over 50%, in across the Real Estate Board of Greater Vancouver (REBGV), except for West Vancouver (-1.0%).
- The next two-year period, Apr. 2018 through Mar. 2020 saw dramatic changes in the higher priced markets: Prices
- in West Vancouver, Vancouver, White Rock, North Vancouver, Richmond, and Burnaby fell by double digits, and mid-range markets registered price decreases.
- The most ‘affordable’ markets – Langley, Surrey, Maple Ridge, Langley City, Pitt Meadows, and Bowen Island –experienced decreases of -2.3 to -4.8% from Apr. 2018 through Mar. 2019 but by the end of Mar. 2020 were up between 51.0 and 56.2% over Apr. 2016.
- Only Squamish and Whistler avoided price decreases from Apr. 2016 through Mar. 2020 and were up 57.7 and 51.6%over Apr. 2016.

YoY
April 2020 through March 2021
After COVID restrictions were imposed in Mar. 2020, prices increased another 5.4 to 15.6% across the REBGV by
In Metro Vancouver, five years after the foreign buyers’ tax and PTT increases were imposed, prices had increased between 9.7 and 25.7% in the high-end market and between 64.8 and 75.8% in the ‘affordable’ markets. Bowen Island’s MLS® HPI had increased 74.7%.
Senior governments are hampered by partisan opposition and encumbered by bureaucracy are not well equipped to expediently deal with housing solutions. Canada will be in another election before most of the parties solutions begin to have an impact.
The problem is better addressed by community groups ‘on the ground’ that are familiar with the local issues and able to more effectively influence local/municipal policies and actions. For example: If Bowen Island Municipality removed the restriction on manufactured home neighbourhoods and provided municipal land—perhaps on the somewhat flat area above Bowen Court—on a long-term lease to an operator/developer, the island could have more affordable housing much sooner than through traditional approaches and additional properties to share the cost of the new Cove Bay Water Treatment Plant, and in the future, the expansion of the Snug Cove Sewer System.
Affordable housing is essential for the health of the economy, the community, and the individual.
STATS ON BOWEN is an analysis of the detached home market activity on Bowen Island.
Published during the month following.
If you would like STATS ON BOWEN sent to your inbox,
WE DO NOT SPAM.
You will only receive email related to the STATS ON BOWEN monthly reports and the occasional update.