IT’S A SELLER’S MARKET ON BOWEN
Comparing the month of July 2020 to July 2019, inventory available was down -26.5 per cent, dollar volume of sales was up 51.6 per cent and the average sale price was up 34.7 per . The number of sales was only up 12.5 per cent, indicating an increased interest in higher priced properties, and average days on market was down 55.3 per cent.
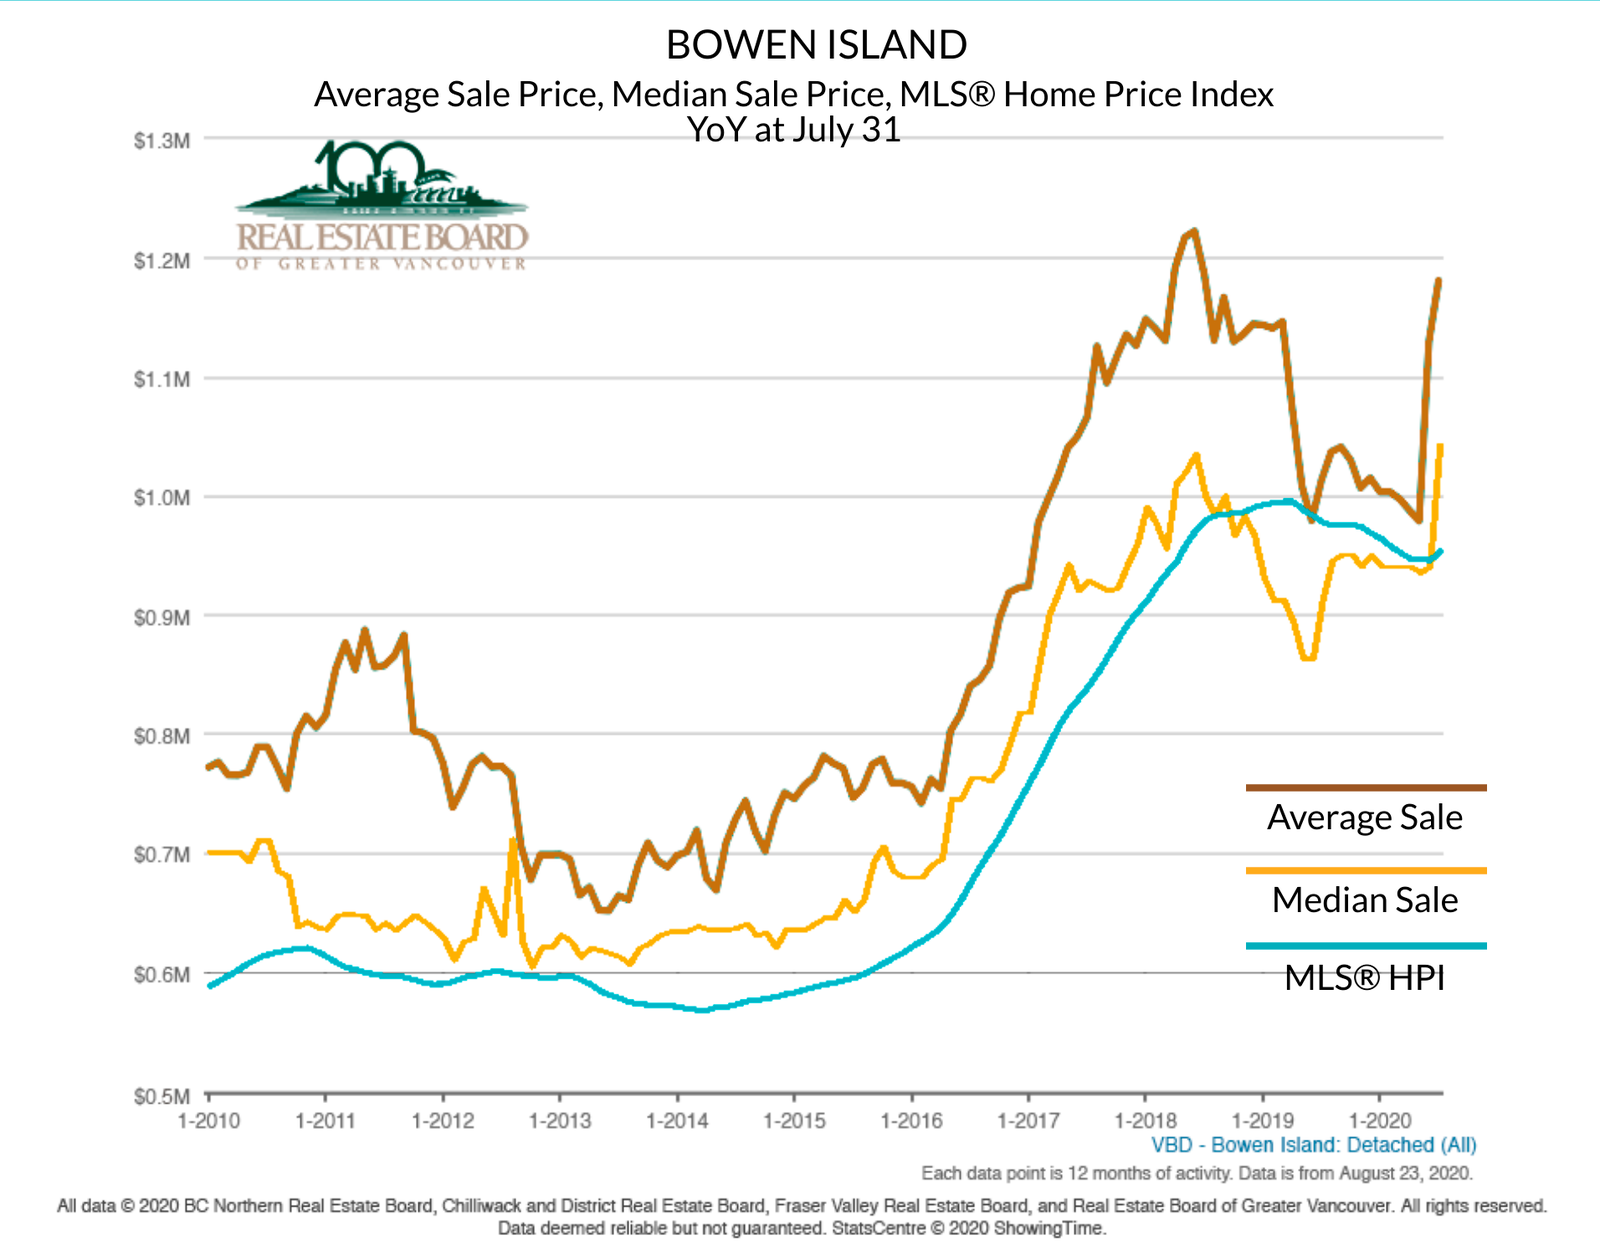
Compared to 6 months ago, the average sale and median sale were up 17.7 and 10.9 per cent respectively. The MLS® HPI which grew slightly in June and July was 0.03 per cent below that in February. Year-over-year the average sale price was up 19.1 per cent, number of sales up 51.2 per cent, and dollar volume up 80.1 per cent.
What’s selling? Year-over-year 45.2 per cent of sales were under $1.0 million (compared to 56.1 per cent in 2019). Sales in the $1.0 - $1.5 million range accounted for another 45.2 per cent (36.6 per cent in 2019) and the remaining 9.7 per cent were sales over $1.5 million (7.3 per cent in 2019).
The good news for sellers: low inventory is reducing pressure on list price, with sale price +3.1 per cent greater than list price in July and only down -4.7 per cent from list year-over-year, and -0.6 per cent year-to-date.
Even as cost creep up, all indicators show continued strong interest from buyers, with days on market down and average sale price (YoY) up sharply in June and July. This interest is due to pent up demand – the public was waiting for a stagnant market to indicate where is was going – COVID-19 concerns creating more interest in larger properties and a rural lifestyle, and very desirable interest rates which are not likely to go lower.
Even as cost creep up, all indicators show continued strong interest from buyers, with days on market down and average sale price (YoY) up sharply in June and July. This interest is due to pent up demand – the public was waiting for a stagnant market to indicate where is was going – COVID-19 concerns creating more interest in larger properties and a rural lifestyle, and very desirable interest rates which are not likely to go lower.
MONTH OF JULY 2020
SALE PRICE LOW $ 840,000 LIST PRICE $ 848,000
SALE PRICE HIGH $3,500,000 LIST PRICE $3,500,000
AVERAGE SALE: $1,452,173 MEDIAN SALE: $1,146,194
DAYS ON MARKET: AVERAGE – 26 MEDIAN – 9
AVERAGE SALE: $1,452,173 MEDIAN SALE: $1,146,194
DAYS ON MARKET: AVERAGE – 26 MEDIAN – 9
BOWEN ISLAND YOY STATS
@31 July 2020
• MLS®HPI: $954,550
• Median Price: $1,055,000
• Average Price: $1,336,283
@31 July 2020
LOT prices averaged $10.23 to $17.12 per sq. ft.
@31 July 2020
• MLS®HPI: $954,550
• Median Price: $1,055,000
• Average Price: $1,336,283
@31 July 2020
LOT prices averaged $10.23 to $17.12 per sq. ft.
STATS ON BOWEN is a detailed analysis of activity on Bowen Island published monthly,
usually within seven days from the end of the month.
If you would like notice of the most recent STATS ON BOWEN sent to your inbox
you can SUBSCRIBE HERE free of charge.
WE DO NOT SPAM.
You will only receive email related to the STATS ON BOWEN monthly reports.
You will only receive email related to the STATS ON BOWEN monthly reports.