Increases in YoY dollar volume, number of sales, and average sale price from June is an encouraging sign that perhaps the market is beginning to stabilize, albeit well below the levels experienced during the Q2, 2018. The Real Estate Board of Greater Vancouver REALTOR® Report Sales-to-Active Ratio shows Bowen Island to be in a balanced market (favouring neither buyers nor sellers) for the first time since December 2018.
Not all indicators are up. The year over year closing price as a per cent of listing price fell below 96% to February 2016 levels and the average price per square foot has continued to decline since March 2019, down -21.4 per cent YoY.
The July YoY average sale price showed its first increase since March 2019, rising 3.4 per cent from June 2019 while the Home Price Index is down -1.8 per cent from its high in March of 2019.
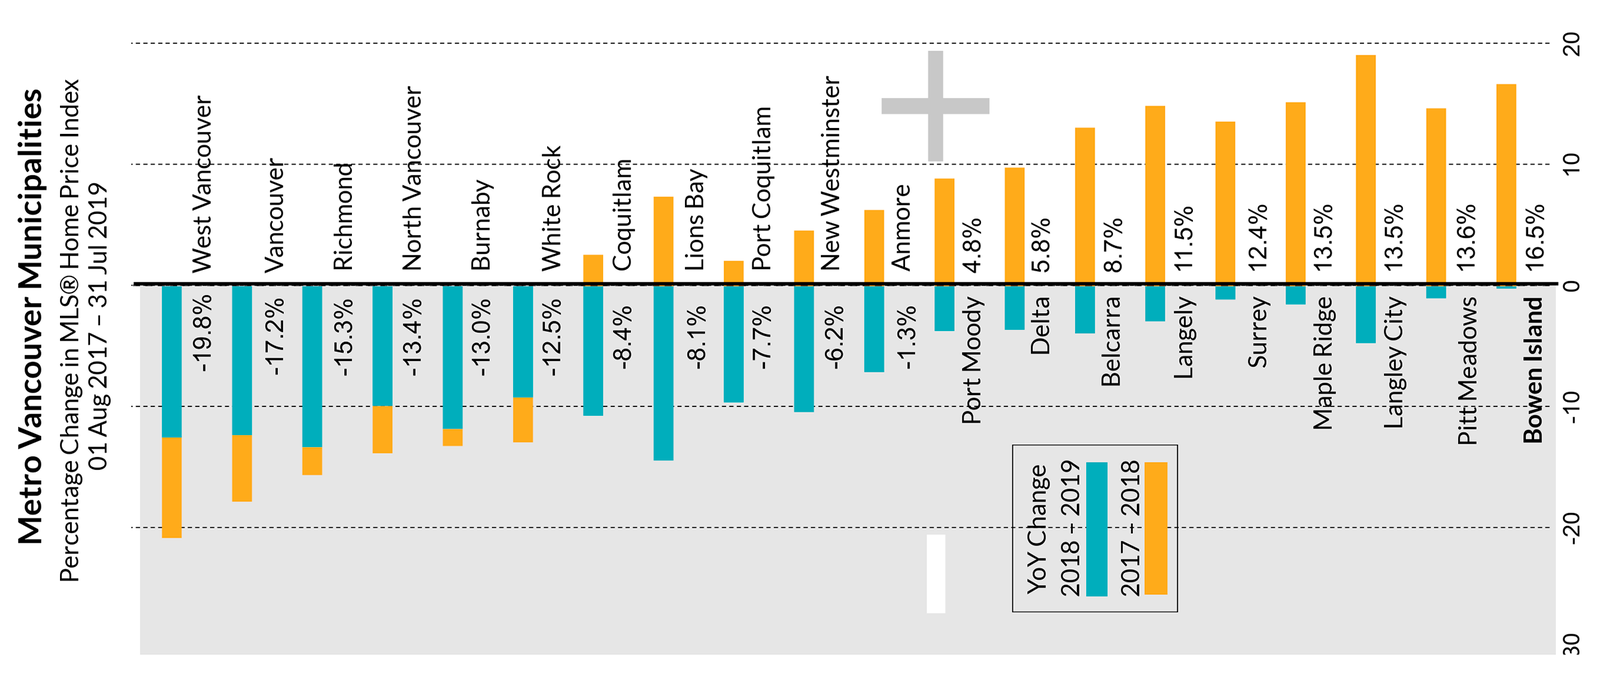
The Bowen Island market continues to be more resilient than our Metro Vancouver neighbours. Our YoY decline in the MLS®HPI at -0.2 per cent was the lowest followed by Pitt Meadows at -1.0 per cent. During the same period, Lions Bay experienced the highest YoY decline at -14.4 per cent and the average decline in Metro Vancouver was -8.0 per cent.
Bowen Island real estate has also held its value over the last 2 years. The YoY MLS® HPI is up up 16.5 per cent from 2017 followed by Pitt Meadows at 13.6 per cent, while White Rock, Burnaby, North Vancouver, Richmond, Vancouver, and West Vancouver losses ranged from -12.5 per cent to -19.8 per cent over the same period.
Prices for houses sold in July ranged from -7.0 per cent below the BC Assessment value to 24.7 per cent above with the average at 9.8 per cent above.
BOWEN ISLAND YOY STATS
@31 July 2019
MLS®HPI: $950,600
Median Price: $940,000
Average Price: $1,022,333
MLS®HPI: $950,600
Median Price: $940,000
Average Price: $1,022,333
@30 June 2019
MLS®HPI: $1,018,400
Median Price: $937,500
Average Price: $966,131
STATS ON BOWEN is a detailed analysis published monthly once all data for the month has been reported.
For example, the January report would be published during the last week of February.
For example, the January report would be published during the last week of February.
If you would like early access to the report during the first week of the month,